Published: 2024-04-18T13:38:59.000Z
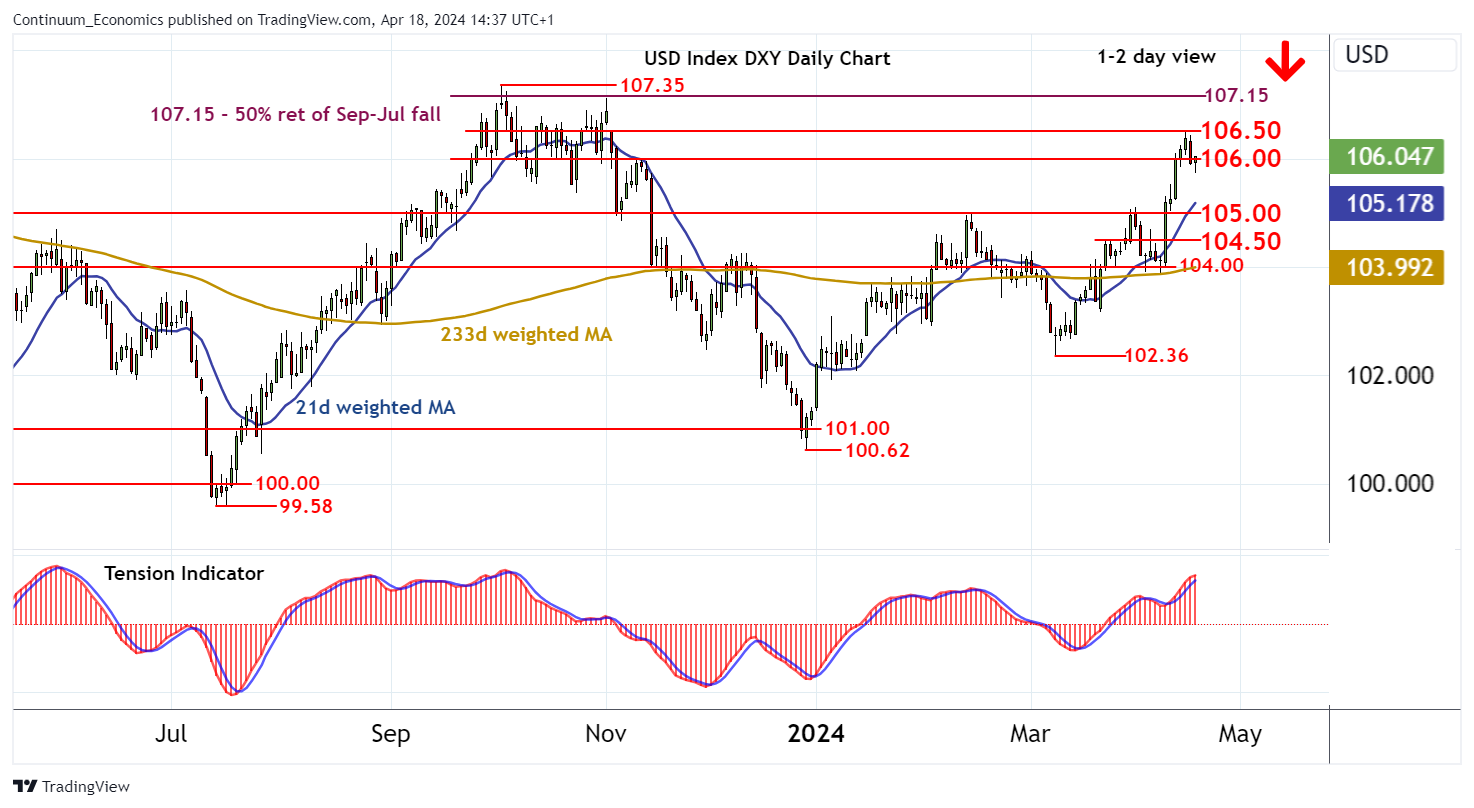
Chart USD Index DXY Update: Under pressure - room for lower

Senior Technical Strategist
1
The anticipated break below 106.00 has reached 105.75~
| Levels | Imp | Comment | Levels | Imp | Comment | |||
|---|---|---|---|---|---|---|---|---|
| R4 | 108.00 | * | congestion | S1 | 105.00 | ** | break level | |
| R3 | 107.15/35 | ** | 50% ret of Sep-Jul fall; 3 Oct 2023 (y) high | S2 | 104.50 | break level | ||
| R2 | 106.50 | * | congestion | S3 | 104.00 | * | congestion | |
| R1 | 106.00 | ** | congestion | S4 | 103.88 | ** | 9 Apr (w) low |
Asterisk denotes strength of level
14:20 BST - The anticipated break below 106.00 has reached 105.75~, where unwinding oversold intraday studies are prompting a short-term bounce back to 106.00. A test above here is possible, but daily studies are deteriorating and broader weekly charts are coming under pressure, highlighting increased selling interest towards further congestion around 106.50. In the coming sessions, cautious trade is expected to give way to further losses, with initial focus to turn to 105.00. Mixed weekly charts could limit any tests in renewed consolidation.