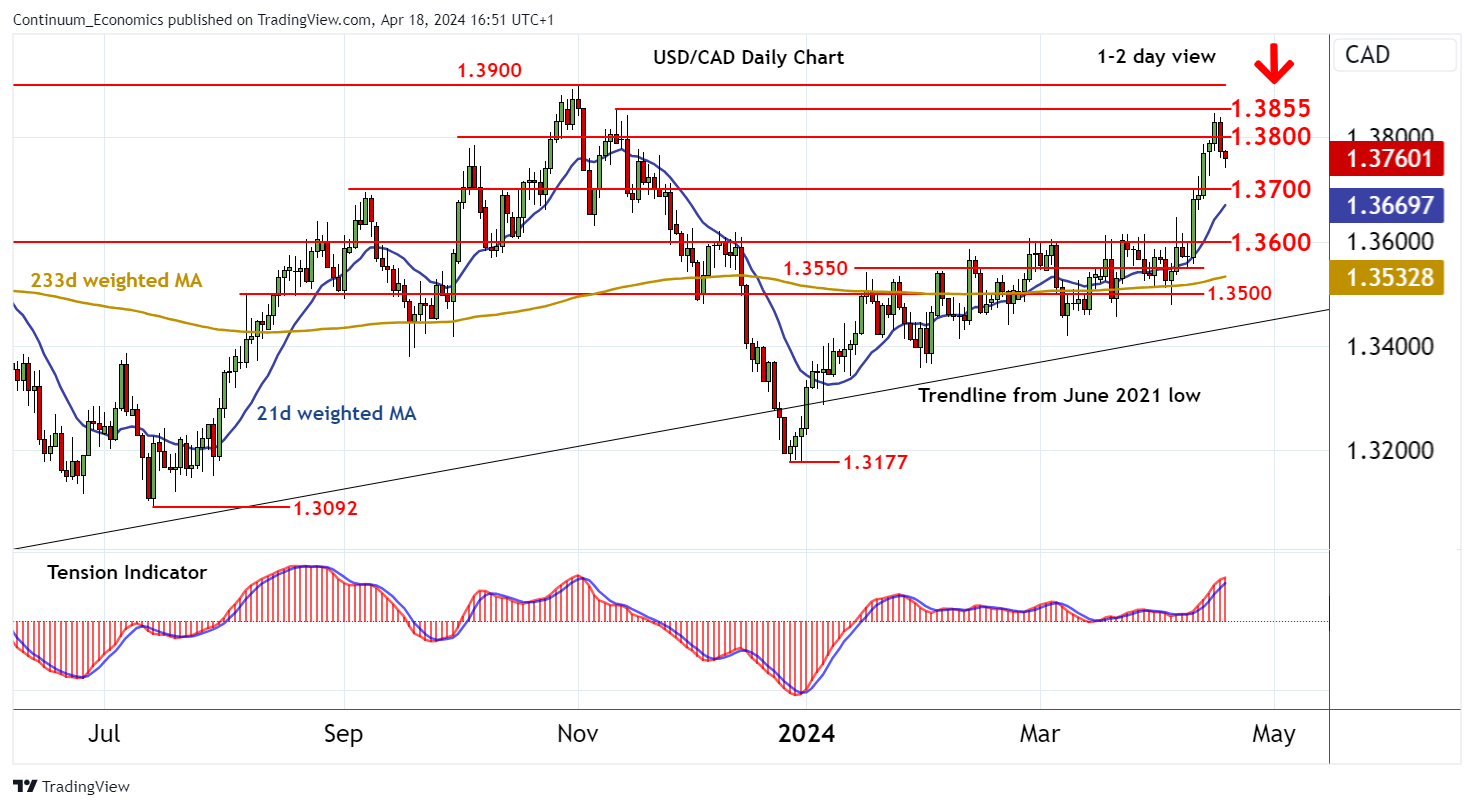
Chart USD/CAD Update: Leaning lower

Anticipated losses have broken below 1.3800 to reach 1.3760, where oversold intraday studies are prompting short-term reactions
| Levels | Imp | Comment | Levels | Imp | Comment | |||
|---|---|---|---|---|---|---|---|---|
| R4 | 1.3900 | ** | 1 Nov 2023 YTD high | S1 | 1.3700 | ** | congestion | |
| R3 | 1.3855 | * | 10 Nov (w) high | S2 | 1.3650 | congestion | ||
| R2 | 1.3845 | * | 16 Apr YTD high | S3 | 1.3600 | ** | break level | |
| R1 | 1.3800 | ** | congestion | S4 | 1.3550 | * | break level |
16:35 BST - Anticipated losses have broken below 1.3800 to reach 1.3760, where oversold intraday studies are prompting short-term reactions. Overbought daily stochastics are unwinding and the rising daily Tension Indicator is flattening, suggesting a deterioration in sentiment and room for deeper losses in the coming sessions. Focus is turning to congestion support at 1.3700, but rising weekly charts could limit any initial tests in consolidation. Further slippage would add fresh weight to already negative price action and extend losses towards congestion around 1.3650, where fresh buying interest is looked for. Meanwhile, a close back above congestion resistance at 1.3800 will turn sentiment neutral and prompt consolidation beneath strong resistance at 1.3845/55.